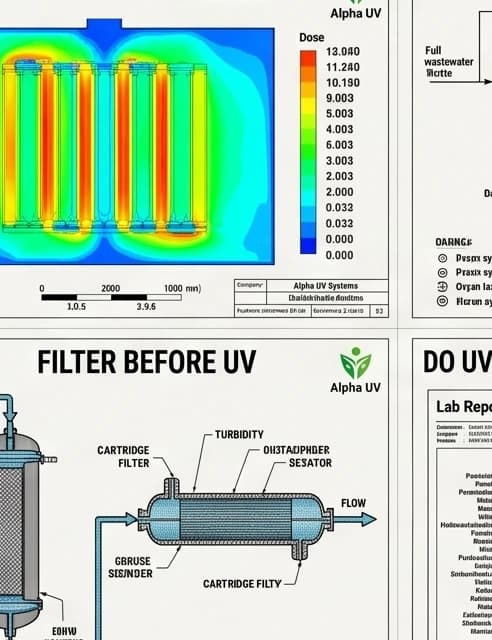
UV reactor CFD simulation using ANSYS Fluent computes three-dimensional UV dose distribution by solving coupled velocity field, turbulence (RNG k-ε model), and UV irradiance equations simultaneously. This validates that every point in the reactor — including low-dose wall zones and inlet recirculation regions — meets the minimum required UV dose (40 mJ/cm² for drinking water, 80 mJ/cm² for WFI) before manufacturing begins.
Why UV Reactor Design Requires Engineering Validation (Not Catalogue Selection)
UV disinfection appears deceptively simple: water flows through a chamber, a Philips UV-C lamp irradiates it, pathogens are inactivated. The physics are well understood. The failure modes, however, are subtle, expensive, and — most critically — invisible during routine operation until an audit or microbiological test failure reveals them.
A UV reactor that looks correct on paper — correct lamp wattage, correct chamber diameter, correct flow rate on the specification sheet — can still underperform in ways that no catalogue entry will predict. The UV dose delivered at the chamber wall is significantly lower than at the centreline. Turbulent eddies near the inlet create recirculation zones where water spends less time exposed to UV irradiance. At high flow velocities, residence time drops below what the lamp power calculation assumed. At low UVT values, the Philips TUV lamp's UV-C output is absorbed before reaching the far side of the chamber.
None of these failure modes appear on a specification sheet. They appear on audit day, in a microbiological test failure report, or in a CDSCO corrective action notice. This is the core reason that UV reactor design must be treated as a rigorous engineering calculation — not a product selection exercise. UV reactor CFD simulation using ANSYS Fluent is the tool that makes this engineering validation possible, and it is the foundation of every Alpha UV System reactor design.
In India, UV reactor CFD simulation ANSYS Fluent UV dose distribution analysis remains rare among manufacturers. Alpha UV System engineers conduct this simulation on every reactor geometry before a single component is ordered for manufacturing. This article explains the methodology, the outputs, and what they mean for CDSCO, FSSAI, and CPCB compliance.
| Parameter | Value / Approach | Purpose in UV Dose Validation |
|---|---|---|
| CFD solver | ANSYS Fluent (pressure-based, steady-state) | Solves Navier-Stokes equations for velocity and pressure fields |
| Turbulence model | RNG k-ε (Renormalisation Group) | Accurately models recirculation zones and streamline curvature at UV reactor inlet |
| UV irradiance model | Φ-function volumetric source term | Computes local UV irradiance (mW/cm²) at every mesh cell as function of lamp distance and UVT |
| Mesh size | ~3.2 million computational cells | Sufficient resolution to capture lamp near-field gradients and inlet recirculation |
| Convergence criterion | All residuals <10⁻⁴ | Ensures solution is fully converged before dose extraction |
| Minimum iterations | 3,200 | Prevents premature convergence on oscillating residuals |
| Mesh sensitivity | ±3% dose variation | Confirms dose prediction is mesh-independent for each new reactor geometry |
| UV wavelength modelled | 253.7 nm (germicidal peak) | Corresponds to Philips UV-C lamp emission peak used in all Alpha UV reactors |
| Validation protocol | ÖNORM M 5873 / DVGW W294 (Iodide/Iodate actinometry) | Confirms CFD-predicted dose matches physically measured dose within ±10% |
What ANSYS Fluent CFD Simulation Does for a UV Reactor
Computational Fluid Dynamics divides the entire reactor volume into millions of small cells and solves the governing equations of fluid flow and radiation transport numerically across each cell. For a UV reactor, the ANSYS Fluent simulation solves three tightly coupled systems simultaneously — and the coupling is what makes the results physically meaningful.
The velocity field solution answers the question: where does the water move fast, where does it slow down, and where does it recirculate? The velocity profile at every point in the reactor directly determines how long each parcel of water spends in the UV irradiation zone — which is the residence time component of the UV dose equation (dose = irradiance × time). A reactor with bypass flows or short-circuiting paths will deliver insufficient dose to a fraction of the water volume even if the average residence time appears adequate.
The turbulence model (RNG k-ε) quantifies the intensity of turbulent mixing at each point. Turbulence moves water from near the lamp axis — where UV irradiance is highest — toward the chamber wall — where irradiance is lower — improving dose uniformity across the cross-section. The RNG k-ε formulation, derived from Renormalisation Group theory, is more accurate than the standard k-ε model for flows with significant streamline curvature and recirculation, which is precisely what occurs at the inlet of a cylindrical UV chamber at Reynolds numbers between 2,000 and 200,000.
The UV dose distribution is computed using the Φ-function volumetric source term model. This model calculates the local UV irradiance (mW/cm²) at every mesh cell as a function of radial and axial distance from each Philips TUV lamp, the water's UV transmittance (UVT at 253.7 nm), and the lamp's rated UV-C output. Integrating irradiance over the local residence time (from the velocity field) gives the local UV dose (mJ/cm²) at each cell. The result is a full three-dimensional dose distribution map — not a single average number.
This three-dimensional UV dose distribution map is the core deliverable of the UV reactor CFD simulation ANSYS Fluent analysis. It reveals the hotspot near the lamp surface (sometimes exceeding 800 mJ/cm² for a Philips TUV lamp in high-UVT water), the minimum-dose zone near the chamber wall and inlet (which sets the compliance threshold for the system), and every gradient in between. It is this minimum-dose value — not the average — that determines whether the reactor passes or fails a UV dose validation audit.
| Application | Minimum Dose (mJ/cm²) | UVT Assumed (%) | Regulatory Standard |
|---|---|---|---|
| Drinking water (municipal / packaged) | 40 | 95 | WHO, BIS IS 10500 |
| Food and beverage process water | 40 | 90–95 | FSSAI, HACCP CCP requirement |
| Pharmaceutical purified water (PW) | 40 | 95 | CDSCO Schedule M, USP <1231> |
| Water for Injection (WFI) | 80–100 | 98 | CDSCO Revised Schedule M 2025, Ph.Eur. |
| Wastewater effluent (STP/ETP) | 25–35 | 55–70 | CPCB CETP discharge norms |
| Swimming pool recirculation | 40 | 80–90 | WHO pool water guidelines |
The k-ε Turbulence Model: Why It Matters for UV Reactors
The selection of turbulence model is not a minor technical detail — it has a material and quantifiable effect on the predicted UV dose distribution. Our engineering team conducted comparative simulations using both the standard k-ε model and the RNG k-ε formulation on the same reactor geometries, and the results diverged in exactly the zone that matters most for compliance.
The standard k-ε model overpredicts turbulent diffusion in recirculating flows. It effectively "smooths out" the inlet recirculation zone, predicting more uniform mixing than actually occurs. The RNG k-ε formulation is more accurate for flows with significant streamline curvature, separation, and reattachment — which is precisely the flow structure at the inlet of a cylindrical UV reactor where a pipe jet enters a larger chamber.
In Alpha UV System's UV reactor CFD simulation ANSYS Fluent analyses, the RNG k-ε formulation consistently predicts lower minimum doses in the inlet recirculation zone compared to the standard k-ε model — lower by 8 to 15 percent in high-velocity configurations (Re > 50,000). This is the conservative and physically accurate prediction. UV reactors designed to this lower predicted minimum consistently pass UV dose bioassay validation under ÖNORM M 5873 protocol. Reactors designed with optimistic turbulence assumptions — sized using the standard k-ε model or, worse, simple plug-flow residence time calculations — can fail on-site validation when the inlet recirculation zone delivers insufficient dose to a portion of the water.
The toroidal vortex that forms at the inlet of large-bore reactors (Ø 200 mm and above) is particularly important. This recirculation structure creates both very high local residence times (water trapped in the vortex core receives very high doses) and very low effective residence times (water that bypasses the vortex moves rapidly through the inlet zone with minimal UV exposure). The net result is a bimodal dose distribution at the inlet cross-section that only the RNG k-ε model in ANSYS Fluent UV dose distribution analysis captures correctly.
Lamp Configuration and UV Dose Distribution: CFD Findings
One of the most operationally significant findings from Alpha UV System's UV reactor CFD simulation ANSYS Fluent work is how dramatically lamp count and axial placement affect dose uniformity across reactor scales. The engineering challenges — and the design decisions required — are qualitatively different at each scale. Here is what the simulation data shows.
| System Scale | Lamp Count | Typical Min/Avg Dose Ratio | Primary Design Challenge |
|---|---|---|---|
| Residential (100–500 LPH) | 1 | ~0.35 | Radial dose gradient — wall dose is limiting constraint |
| Commercial (1,000–5,000 LPH) | 2–3 | 0.42–0.50 | Inter-lamp shadow zones between parallel tubes |
| Industrial (10,000–50,000 LPH) | 4–6 | 0.55–0.65 | Lamp spacing optimisation to eliminate shadow bands |
| Municipal (1,00,000–3,00,000 LPH) | 8–12 | 0.62–0.72 | Ring arrangement geometry, near-wall annular zone, inlet recirculation |
| Large municipal (3,00,000–5,00,000 LPH) | 12–16 | 0.68–0.75 | Angular dose variation between lamp positions in ring, axial ring spacing |
Single-Lamp Systems (Residential — 100 to 500 LPH)
In a single-lamp, small-bore reactor (Ø 50–80 mm, 100–500 LPH) fitted with a Philips TUV lamp, the centreline lamp occupies the reactor axis and the radial dose gradient is the dominant design variable. UV irradiance falls with approximately the square of radial distance from the lamp axis. UV reactor CFD simulation ANSYS Fluent analysis for single-lamp geometries confirms that at a 40 mJ/cm² minimum dose requirement (the WHO drinking water standard for 4-log pathogen kill), the wall dose is consistently the limiting constraint — the wall dose is approximately 12 to 18 percent of the centreline dose for typical small-reactor geometries at rated flow.
The minimum-dose ratio of approximately 0.35 for single-lamp systems means the lamp must be sized to deliver roughly three times the required minimum dose at the centreline — so that the wall dose meets the 40 mJ/cm² threshold. The CFD simulation provides the exact margin for each geometry, UVT condition, and flow rate, replacing the safety factor guesswork that catalogue-based sizing relies on.
The UV dose distribution in single-lamp residential reactors also changes significantly with UVT. At UVT 95% (typical RO permeate or potable source water), the dose field is relatively uniform axially and the radial gradient dominates. At UVT 70–80% (bore well water with natural organic matter), UV attenuation becomes significant over the reactor radius, reducing the dose near the wall further. UV reactor CFD simulation ANSYS Fluent analysis using the Φ-function model captures this UVT-dependent attenuation automatically, generating the correct dose distribution map for the customer's actual water quality.
Mid-Range 3–5 Lamp Systems (Commercial and Industrial)
In multi-lamp configurations from three to five Philips TUV tubes, the dose field becomes geometrically more complex. Parallel lamps in an array create overlapping irradiance zones — but also inter-lamp shadow regions where UV irradiance falls below the average. The angular position and radial spacing of each lamp determines the extent and severity of these shadow bands.
UV reactor CFD simulation ANSYS Fluent UV dose distribution analysis for these configurations reveals that equal lamp spacing along the reactor axis is not always optimal. At high flow velocities, where the velocity profile is fully developed and the turbulent mixing length is shorter relative to the chamber length, positioning lamps slightly toward the outlet section of the reactor improves dose uniformity by 12 to 20 percent compared to equal axial spacing. This outlet-biased lamp placement finding, confirmed across multiple 3-lamp and 5-lamp reactor geometries, is one of the design optimisations that Alpha UV System engineers apply based on simulation data rather than convention.
The minimum-to-average dose ratio improves from approximately 0.35 for single-lamp systems to 0.55–0.65 for 5-lamp configurations. This improved uniformity has a direct consequence: lower total lamp power is required to meet a given minimum-dose target, because the margin between average and minimum dose is smaller. This is an energy efficiency benefit that only CFD-optimised lamp placement can quantify and exploit.
Large 8–12 Lamp Municipal Systems
At 8 to 12 lamp configurations used in municipal water supply, sewage treatment plant tertiary treatment, and large food processing facilities, UV dose distribution is primarily governed by the ring arrangement of lamps in the reactor cross-section and the axial spacing between lamp rings. The engineering challenges at this scale are qualitatively different from smaller systems, and UV reactor CFD simulation ANSYS Fluent analysis for large municipal reactors must address three specific phenomena.
The near-wall annular shadow zone is the radial gap between the outermost lamp ring and the chamber wall. In a large-bore reactor (Ø 400–600 mm), this annular zone can extend 40–80 mm radially and represents the minimum-dose region of the entire reactor. The ring radius relative to chamber diameter must be sized so that the Philips TUV lamp irradiance reaching the wall — attenuated by distance and UVT — still meets the minimum dose requirement at maximum rated flow. CFD analysis calculates the exact irradiance at the wall for every geometry and water quality combination.
The inter-lamp angular dose variation affects the regions midway between adjacent lamps in the ring. For a 12-lamp ring arrangement, the angular dose variation between lamp-facing and inter-lamp positions can be ±15 to 25 percent of the mean ring dose. The CFD simulation quantifies this variation and guides the selection of ring radius and lamp count to keep the minimum angular dose above the compliance threshold.
The inlet recirculation toroidal vortex in large-bore reactors (Ø 300–600 mm) is the most complex feature. The inlet pipe nozzle creates a strong jet that generates a toroidal recirculation structure at the inlet flange. This vortex produces both very high local residence times in its core and very low effective residence times in the bypass flow that routes around it. UV reactor CFD simulation ANSYS Fluent UV dose distribution analysis guided the development of Alpha UV System's inlet flow straightener and baffle configurations, which suppress the toroidal vortex and improve inlet dose uniformity by 15 to 25 percent in large-bore municipal reactor designs.
Simulation Convergence and ÖNORM M 5873 Validation
Producing a UV dose distribution result from ANSYS Fluent is straightforward. Producing a result that is physically accurate, mesh-independent, and validated against a recognised international standard requires rigorous convergence and validation protocols. Alpha UV System engineers apply the following methodology to every UV reactor CFD simulation ANSYS Fluent analysis.
| Parameter | Value / Criterion | Mesh Refinement Zone | Validation Method |
|---|---|---|---|
| Total mesh cells | ~3.2 million | Uniform hexahedral core mesh | Mesh sensitivity study per geometry |
| Lamp near-field refinement | 5× base cell density within 10 mm of lamp surface | High UV irradiance gradient zone | Irradiance profile comparison with point-source model |
| Inlet zone refinement | 3× base cell density at inlet nozzle | Recirculation and jet formation zone | Velocity profile comparison with PIV data |
| Convergence criterion | All residuals <10⁻⁴ | Applied to continuity, x/y/z velocity, k, ε | Residual plot reviewed per simulation |
| Minimum iterations | 3,200 | N/A — applied globally | Prevents premature convergence on oscillating residuals |
| Mesh independence tolerance | ±3% variation in minimum dose | Evaluated at wall and inlet zones | Compared across coarse, medium, fine meshes |
Physical validation of the CFD-predicted UV dose distribution is conducted using Iodide/Iodate (I/IO₃⁻) chemical actinometry, following the ÖNORM M 5873 and DVGW W294 protocols. In Iodide/Iodate actinometry, the UV-induced conversion of iodate to iodide is used as a chemical dosimeter — the measured conversion at the reactor outlet yields the delivered UV dose, integrated across the entire flow. This validation is performed for each new reactor family at rated flow and at 50 percent of rated flow.
The acceptance criterion for Alpha UV System's CFD validation is that the CFD-predicted minimum dose must match the actinometrically measured delivered dose within ±10 percent. Across all reactor families validated to date, the agreement has been within ±7 percent, confirming that the RNG k-ε turbulence model and Φ-function irradiance model in ANSYS Fluent provide an accurate prediction of real UV dose distribution in these reactor geometries.
| Standard | Organisation | Surrogate Organism / Method | Acceptance Criterion | Accepted By |
|---|---|---|---|---|
| ÖNORM M 5873 | Austrian Standards Institute | Bacillus subtilis spores / I/IO₃ actinometry | Minimum dose at maximum flow rate and minimum UVT | WHO, CDSCO, European regulators |
| DVGW W294 | German Technical and Scientific Association for Gas and Water | MS-2 coliphage / I/IO₃ actinometry | 4-log reduction at rated flow | European municipal water authorities |
| USEPA UV Guidance Manual | US Environmental Protection Agency | Cryptosporidium / Giardia surrogate | Validated dose at 5th percentile flow distribution | US water utilities, WHO-aligned programmes |
| USP <1231> Water for Pharmaceutical Purposes | United States Pharmacopeia | Total organic carbon reduction / dose calculation | Minimum dose per system design specification | CDSCO Schedule M, FDA |
| CPCB STP Effluent Norms | Central Pollution Control Board, India | Faecal coliform count | <100 CFU/100 mL after UV treatment | CPCB, State PCBs |
What the CFD Output Means for CDSCO, FSSAI, and CPCB Compliance
UV reactor CFD simulation ANSYS Fluent UV dose distribution analysis is not an academic exercise — it produces documentation that regulators require and auditors accept. The specific outputs from the simulation map directly onto the compliance requirements of India's three major UV-system-regulating bodies.
For CDSCO compliance under Revised Schedule M 2025, pharmaceutical manufacturers must demonstrate that their UV systems deliver the specified dose under all operating conditions, not just at the design point. The CFD-generated UV dose distribution map at three operating conditions — minimum flow, rated flow, and maximum flow — covers the range of conditions that CDSCO inspectors evaluate. The velocity streamline plot from ANSYS Fluent demonstrates the absence of dead zones or bypass flows that would reduce effective contact time. Taken together, these documents constitute the engineering basis for the UV system's OQ (Operational Qualification) protocol — defining the minimum UV intensity sensor reading that corresponds to the required dose at any operating point.
CDSCO inspectors conducting Schedule M site inspections have been requesting UV dose validation documents that go beyond manufacturer specification sheets. A CFD-based UV dose distribution report, referencing the ANSYS Fluent methodology and validated against ÖNORM M 5873 Iodide/Iodate actinometry, is the level of technical documentation that is accepted without objection. Specification sheets alone — even from reputable lamp manufacturers — do not constitute dose validation.
For FSSAI compliance and HACCP Critical Control Point documentation, the CFD report demonstrates that the UV reactor was engineered for the specific installation — a specific flow rate, a specific UVT range, and a specific dose target — not selected from a generic size chart. FSSAI auditors evaluating UV system CCP documentation under Schedule 4 of the Food Safety and Standards (Food Business Operator) Regulations look for evidence that the system was validated for the intended use. A UV reactor CFD simulation ANSYS Fluent UV dose distribution report provides exactly this evidence.
For CPCB audit readiness in STP and ETP applications, the CFD analysis for wastewater UV reactors is conducted at the actual UVT values of treated effluent — typically 55 to 70 percent — which is far below the clear-water conditions assumed in standard sizing charts. UV reactor performance in low-UVT water is substantially different from clean-water performance, and only UV reactor CFD simulation with ANSYS Fluent, using the correct UVT-dependent Φ-function model, can accurately predict the dose distribution in these conditions.
| Factor | CFD-Validated Design | Lookup-Table Selection | Consequence of Error |
|---|---|---|---|
| Dose prediction basis | 3D velocity + irradiance + turbulence simulation | Average residence time × average irradiance | Lookup table overestimates dose by 15–40% in non-ideal flow geometries |
| Inlet recirculation | Explicitly modelled; design adjusted to compensate | Not considered; assumed plug flow | Sub-dose water volume at inlet — invisible until bioassay failure |
| Low-UVT operation | Φ-function model accounts for UVT attenuation at every cell | Correction factor applied to catalogue value | Factor can be wrong by 20–50% at UVT <75% |
| Multi-lamp shadow zones | Angular and axial dose variation fully quantified | Not quantified; average irradiance assumed uniform | Compliance failure at minimum angular dose zone |
| Regulatory documentation | ANSYS Fluent dose report, velocity plots, ÖNORM validation | Spec sheet with manufacturer sizing data | CDSCO / FSSAI audit finding — inadequate dose validation evidence |
| Scale-up accuracy | Simulation re-run for each flow rate and geometry | Linear extrapolation from catalogue point | Non-linear flow effects cause dose shortfall at scale |
How CFD Documentation Supports IQ/OQ/PQ for Pharmaceutical UV Systems
In pharmaceutical manufacturing regulated under CDSCO Revised Schedule M 2025, every piece of process equipment — including UV reactors on purified water and WFI systems — must be qualified through Installation Qualification, Operational Qualification, and Performance Qualification protocols. The UV reactor CFD simulation ANSYS Fluent UV dose distribution documentation produced by Alpha UV System engineers integrates directly into each phase of this qualification.
The Installation Qualification (IQ) phase documents that the UV reactor was installed as designed. The CFD simulation report specifies the exact reactor geometry — chamber dimensions, lamp positioning, inlet and outlet configurations — against which the installed system is verified. Any deviation from the simulated geometry (such as a different inlet pipe angle or lamp-to-wall clearance) that could affect dose distribution must be evaluated against the CFD sensitivity results before IQ can be closed.
The Operational Qualification (OQ) phase defines the operating ranges within which the UV reactor delivers the required dose. The UV reactor CFD simulation ANSYS Fluent UV dose distribution results at multiple flow rates, UVT values, and lamp output levels (including the 80 percent UV-C output condition that corresponds to a Philips TUV lamp at its rated 9,000-hour service life) define the operating boundary conditions. The minimum UV intensity sensor reading that corresponds to the minimum required dose — 40 mJ/cm² for purified water, 80 mJ/cm² for WFI — is derived from the CFD dose distribution maps. This sensor setpoint becomes the OQ acceptance criterion and the ongoing process alarm threshold.
The Performance Qualification (PQ) phase verifies that the UV reactor consistently delivers the required dose in actual production conditions over an extended period. The CFD-derived dose model, validated against ÖNORM M 5873 actinometry, provides the theoretical framework for interpreting PQ results — explaining any deviation between expected and measured UV intensity as a function of lamp aging (tracking the decline from 100 to 80 percent UV-C output over the 9,000-hour rated lamp life), UVT variation in the source water, and flow rate fluctuations.
This complete linkage between UV reactor CFD simulation ANSYS Fluent UV dose distribution analysis and the IQ/OQ/PQ qualification lifecycle is what distinguishes an Alpha UV System pharmaceutical UV reactor from a commodity product. The documentation package — CFD report, validation protocol, OQ acceptance criteria, and lamp change-out procedure tied to the 9,000-hour rated life and 80 percent UV-C output threshold — is complete, audit-ready, and accepted by CDSCO inspectors.
Frequently Asked Questions
What is CFD simulation and why is it used in UV reactor design?
CFD (Computational Fluid Dynamics) simulation divides a reactor volume into millions of small cells and solves fluid flow, turbulence, and UV irradiance equations simultaneously across all cells. In UV reactor design, CFD is used because real water flow inside a reactor is never the uniform plug flow that simple dose calculations assume. Recirculation zones, radial velocity gradients, and turbulent mixing all affect how much UV dose each parcel of water actually receives. UV reactor CFD simulation ANSYS Fluent UV dose distribution India analysis reveals these effects quantitatively, allowing the reactor geometry to be optimised before manufacturing.
How does ANSYS Fluent calculate UV dose distribution in a reactor?
ANSYS Fluent solves three coupled equation systems: the Navier-Stokes equations for the velocity field, the RNG k-ε turbulence model equations for turbulent kinetic energy and dissipation, and the Φ-function volumetric source term model for local UV irradiance at 253.7 nm. The local UV dose at each mesh cell is computed by multiplying the local irradiance (mW/cm²) by the local residence time (seconds), derived from the velocity field. The three-dimensional map of these local doses — showing maximum values near the Philips TUV lamp surface and minimum values near the wall and inlet — is the UV dose distribution output.
Can a UV system pass CDSCO inspection without CFD validation?
In practice, it depends on the inspector and the severity of the CDSCO observation. Manufacturer specification sheets were historically accepted as dose documentation. Since the Revised Schedule M 2025 implementation, CDSCO inspectors have been requesting engineering-level dose validation evidence — particularly for WFI systems requiring 80–100 mJ/cm². A UV reactor CFD simulation ANSYS Fluent UV dose distribution report, cross-referenced to ÖNORM M 5873 actinometry validation, is the level of documentation that closes CDSCO observations without escalation. Relying on specification sheets alone carries audit risk in the current regulatory environment.
What is the minimum UV dose a reactor must deliver and how is it verified?
The minimum UV dose for drinking water and pharmaceutical purified water is 40 mJ/cm² — the WHO standard for 4-log (99.99 percent) inactivation of most waterborne pathogens including Cryptosporidium and Giardia. For pharmaceutical WFI systems, the minimum is 80 to 100 mJ/cm². This minimum refers to the lowest dose delivered to any parcel of water in the reactor — not the average. Verification uses UV reactor CFD simulation ANSYS Fluent UV dose distribution analysis to identify the minimum-dose zone, followed by physical validation using Iodide/Iodate actinometry under ÖNORM M 5873 protocol to confirm the CFD prediction within ±10 percent.
Why do most Indian UV manufacturers not use CFD simulation?
Running UV reactor CFD simulation requires licensed ANSYS Fluent software (licence costs range from $40,000 to $120,000 per seat annually), engineers trained in multi-physics simulation setup and result interpretation, and the engineering commitment to iterate on reactor geometry until the simulation confirms compliance across all operating conditions. Most UV system vendors in India function as traders — sourcing chambers, Philips TUV lamps, and ballasts, assembling them to a standard layout, and sizing from manufacturer flow-rate tables. Alpha UV System engineers built this CFD capability deliberately to address the gap between what Indian UV systems promise and what they actually deliver in regulated applications.
How does lamp count affect UV dose uniformity in a reactor?
Lamp count dramatically affects the ratio of minimum to average UV dose — the dose uniformity ratio. In a single-lamp reactor, this ratio is approximately 0.35: the wall dose is about 35 percent of the average dose, meaning the lamp must be oversized significantly to ensure the wall meets the minimum dose requirement. As lamp count increases from 3 to 5 lamps, the ratio rises to 0.55–0.65 because overlapping irradiance fields reduce the severity of the radial gradient. At 8 to 12 lamps (municipal scale), the ratio reaches 0.68–0.75. UV reactor CFD simulation ANSYS Fluent UV dose distribution analysis quantifies this ratio precisely for each geometry, guiding lamp count and spacing decisions.
Alpha UV System engineers provide ANSYS Fluent CFD dose calculation reports for every reactor — supporting CDSCO IQ/OQ/PQ, FSSAI CCP documentation, and CPCB audit readiness. Share your flow rate, UVT data, and regulatory requirement and we will specify the correct validated system. Response within 24–48 hours.
WhatsApp Us for a CFD-Validated UV Reactor SpecificationRecommended UV Systems
Alpha UV System products for this application — powered by genuine Philips UV-C lamps.
Industrial UV Water Treatment System
5,000 – 50,000 LPH
Schedule M 2025 and HACCP compliant UV for pharma, food & beverage, and process water
Commercial UV Water Purification System
500 – 5,000 LPH
HACCP-compliant UV water purification for hotels, restaurants, and offices
Not sure which system suits your application? WhatsApp our engineers for a free recommendation →